Viewing and Downloading Visitor Device Breakdown Analytics
This is a type of engagement analytics that tells the different types of devices (mobile, desktop, etc.) and operating systems (Windows, Mac, etc.) that have been used to connect to your platforms in the last 30 days. So Let’s get you one step closer to getting MORE customers and MORE help!
To get started:
- Ensure you are logged in to your Pupsai account. For help logging in, refer to Login to Pupsai.
- Ensure you have subscribed to Pupsai. If you have not done so and need help subscribing, refer to Subscribing To Pupsai.
From your dashboard:
- In the navigation bar to the left of the page, select the “Wiggles” menu option
- From the drop down menu, select “Lead Analytics”
- You’ll be redirected to the “Lead Analytics” page
- Scroll down to the “Visitor Device Breakdown” section, shown in the image below

- To download the analytics data:
- Click the excel icon in the top right corner of the rectangle. An excel file with the data will be downloaded to your computer.
- To download a picture of the chart displayed:
- Click the image icon in the top right corner of the rectangle. An picture file (.png) will be downloaded to your computer.
- N.B: If there is no data available for the metric, this emoji 😯 will be displayed, no charts will be displayed and nothing will be downloaded.
To get more detailed analytics or analytics for a time period past the last 30 days:
- Scroll up and click the “GET MORE DETAILED ANALYTICS LIVE AND IN YOUR EMAIL” button
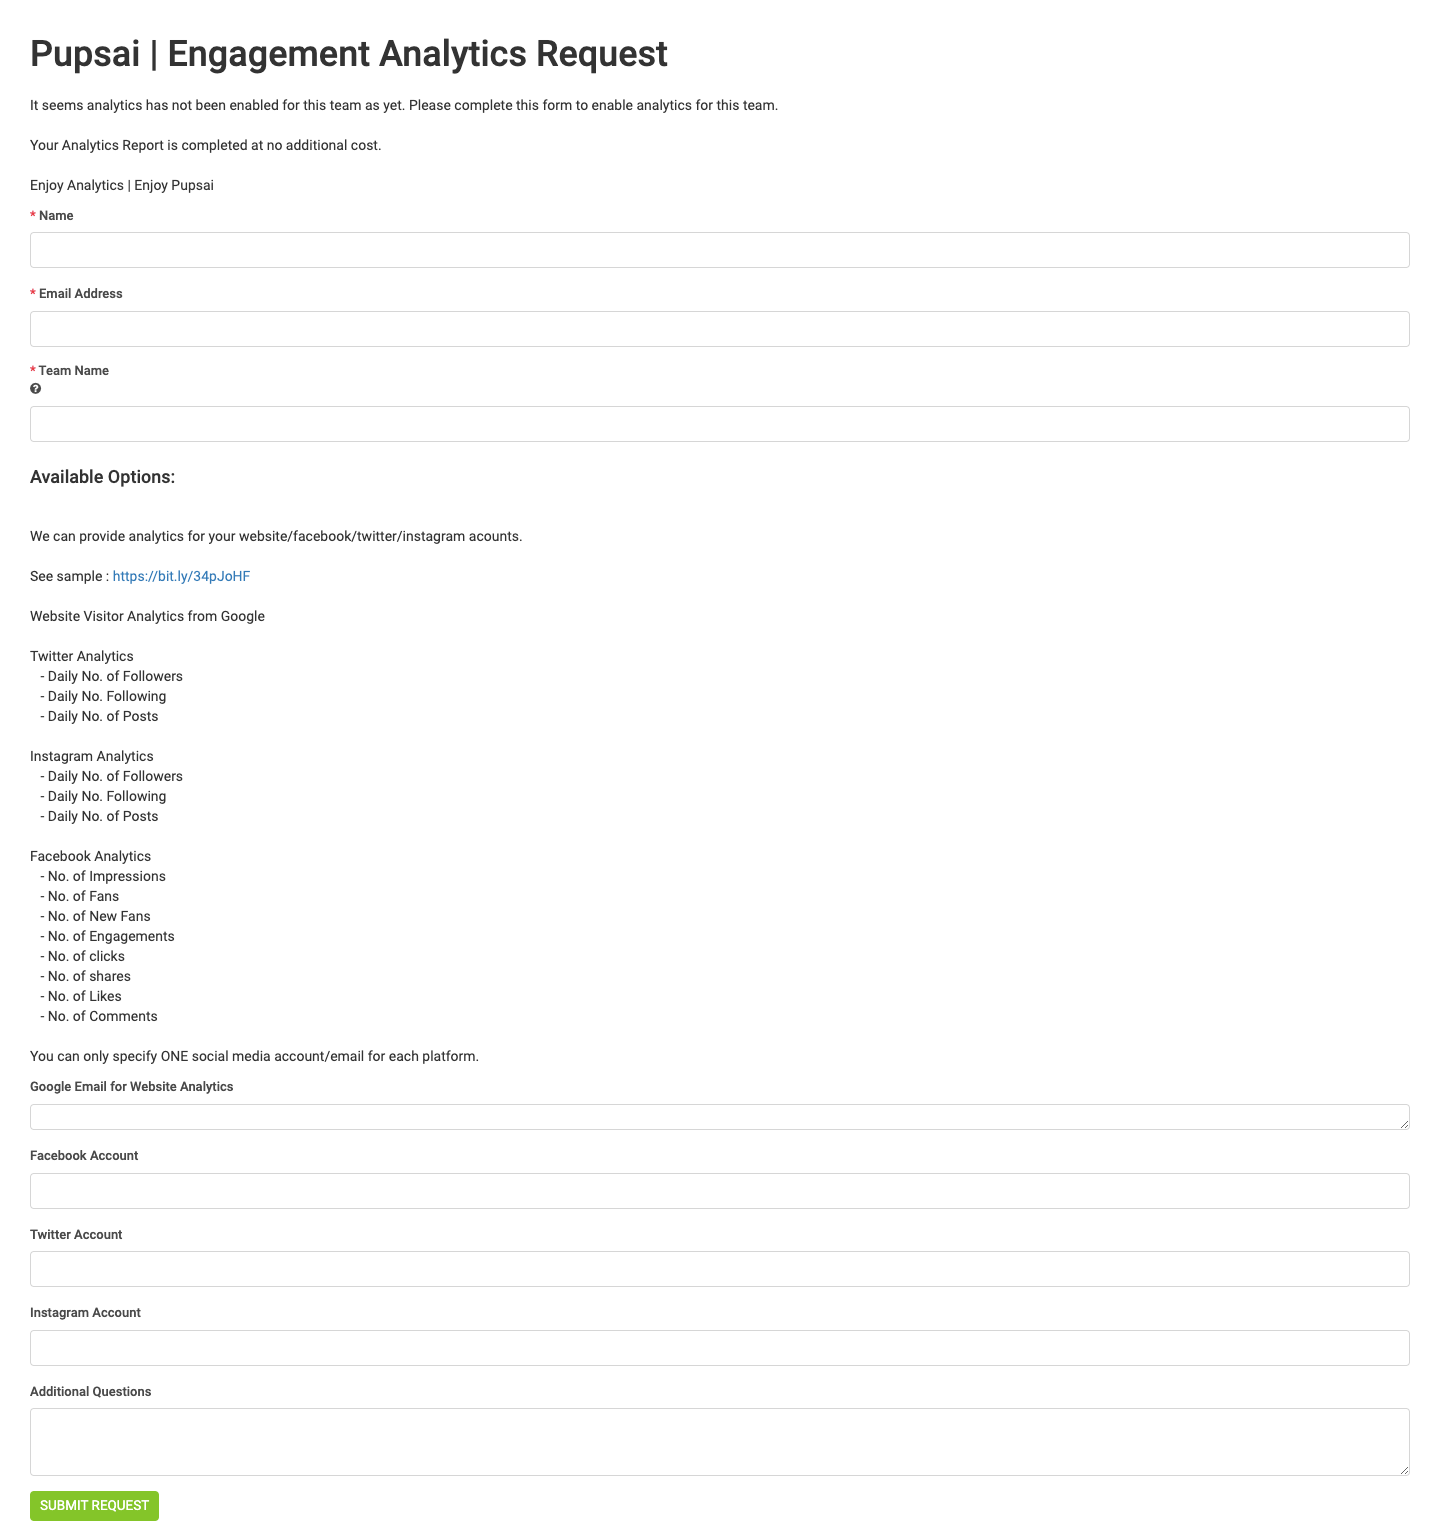
- You’ll be redirected to the “Engagement Analytics Request” Page seen below.
- Enter the required fields
- Click the “Submit Request” button
- Once your request is received by the Pupsai team, a representative will be in contact with you